LangJam is a whimsical exploration of flexible, interactive models of linguistic data. These models could ideally be applied to many linguistic domains, but in this project I focused on applications for endangered language documentation and second language acquisition. This was my honors senior capstone project, and I was chosen to present at our capstone celebration.
(All illustrations drawn by me)
I have always been fascinated and enamored with language. Ever since I heard my dad practicing with his Japanese audio tapes for business trips, I could not stop wondering about the world outside of English. Japanese came naturally to me later.
As far as research, there were a few questions lingering around in my mind that I wanted to pursue. I read a few interesting books, articles, and watched some interesting studies in my linguistics class. But nothing quenched my thirst like endangered languages did. The idea of so many languages existing and dying every week excited and upset me simultaneously.
There are about 7,000 living languages today; and one language dies every two weeks. In our lifetime, at least 1,500 languages will die. And every time a language dies, a unique culture and perspective dies, too.
This is why we need a model for data than can stand against time. Creating a model that is flexible, multi-purpose, and durable is a step in the right direction.

At first, it was “How can I cultivate a language?” and “How can I enhance current endangered language documentation methods from a design perspective?” You can see my initial design brief here. Maybe a bit too presumptuous, or ambitious, for my undergraduate final project, I think. Especially since I have no authority or mastery of linguistics or language documentation; I only have my own determination and a keen interest. But it lead me in the right direction. I know I care about endangered language documentation. And I am in the middle of my own second language acquisition. And somehow, I want to mold my research into something relevant to me, or else I would have no authority over the topic at all. It would all be impersonal and dispassionate. つまらない。
Finally, the research progressed around the idea of “visualizing a language,” and if this is possible at all. Additionally, I want to know if I could somehow enhance linguistic data that supplements language documentation methods – rather than naively trying to reinvent the entire process myself.
So, how can we visualize a language? This is a really difficult question. Should I start with the fundamentals of language? Linguistics? Or should I think about how people use language? No, I should think about the purpose. I cannot create a one-fits-all model (right now anyway). I don’t have the time or resources. I need to think about why.
So why do I want to make this. Who will it benefit?
I want to make this for linguists trying to document a language. It could also support people who are learning a language. But I think this project could be useful in many ways, so I don’t want to limit its potential applications.
What does language – at its core – show us? Communication is the ultimate purpose of language – we all know this. But how do I categorize, quantify, or parse the idea of language? Simply put, how can I transform a language into visual data?
Well, It turns out there is loads of data in language.
When we talk about linguistic data for endangered language documentation, data and metadata are as important to a field linguist as ingredients are to a chef, or variables to a mathematician.
A linguist can collect various kinds of data, some of which include the primary data of a speech community and an apparatus of data, which includes metadata and resources. This can also include a lexicon or dictionary of the language which requires hierarchy and organized structure.
And in order to collaborate or continue research others have started, the data must be transferable and comprehensible to different kinds of people over different generations. This can be difficult with subjective material and ever-changing technologies.
But, what kind of data is linguistic data? How do I display linguistic data visually in a way that makes sense?
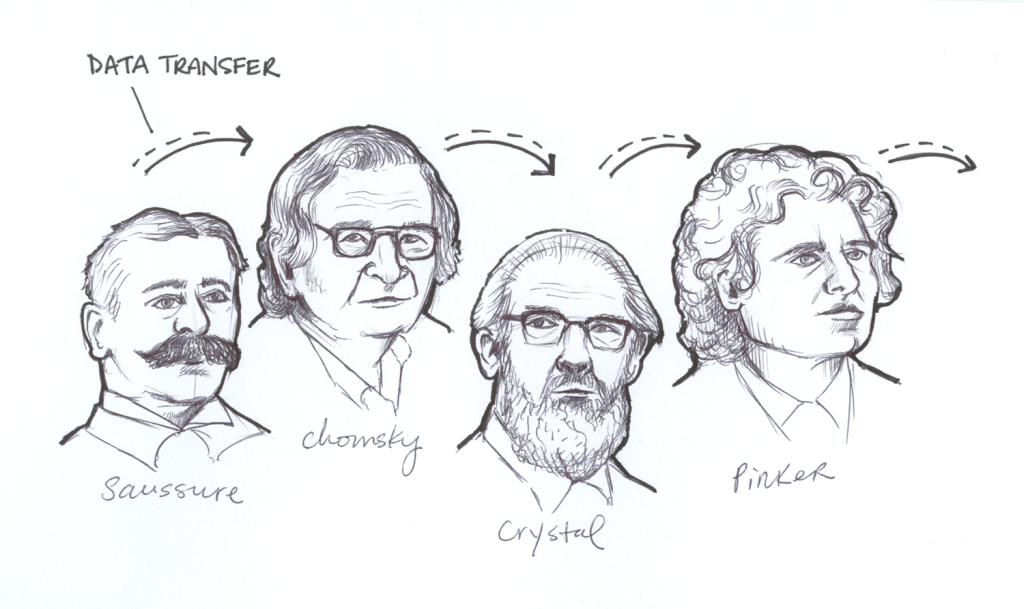
handmade illustration of famous linguists over time
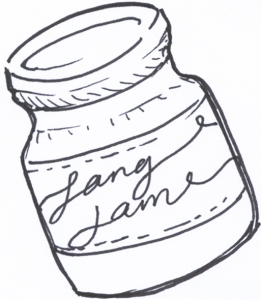
For the design, I want a sense of whimsy. This project is a very complex concept, so I need to find a simple, playful way to convey its meaning. And who doesn’t love a good analogy? Enter —> LangJam.
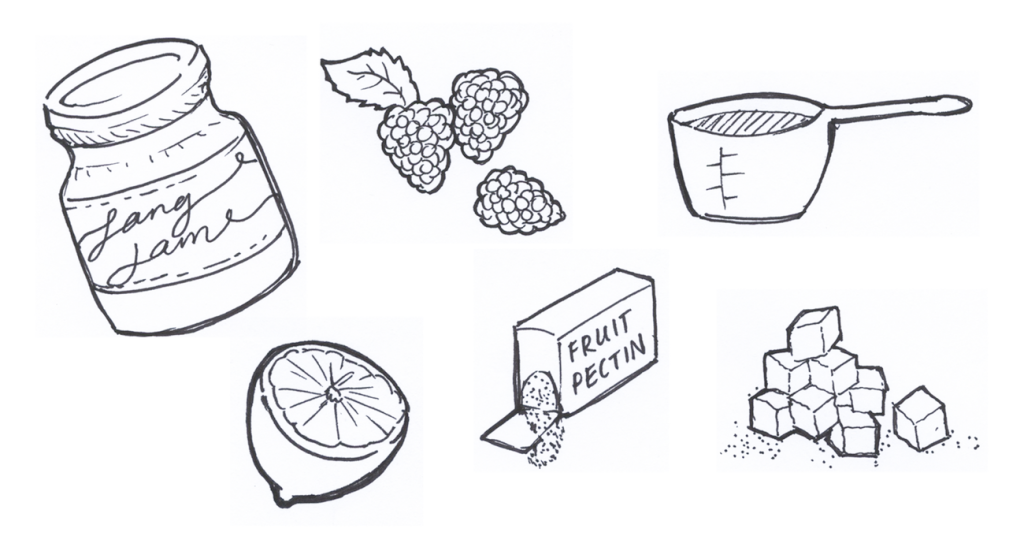
Another word for jam is _________? Preservatives! (If you thought “jelly” you are sorely mistaken. Jam and jelly are completely different.) And what do you do to endangered languages? You preserve them! Get it?? Ha. Yeah. I think it’s funny. With this, I can give identities to each part of the analogy: Different flavors of jam = different parts to the story; The ingredients of jam = the ingredients to a language etc. Furthermore, the ingredients’ purpose translates over to the language analogy. For example, in jam, the biggest preserving agent is the citrus that’s added. So, what would the citrus represent in the language scenario? What about the berries in the jam – “the meat”? What is “the meat” or “flavor” of language? It’s an interesting question when phrased that way, isn’t it?
Analogies aside – this allows me to make linguistic ideas and theories quite clear to non-linguists. It’s berry useful. This, combined with a bold, fun color palette and handmade illustrations and animations, LangJam came to life.
What kind of deliverables do I want – and can feasibly create – in 5 months?
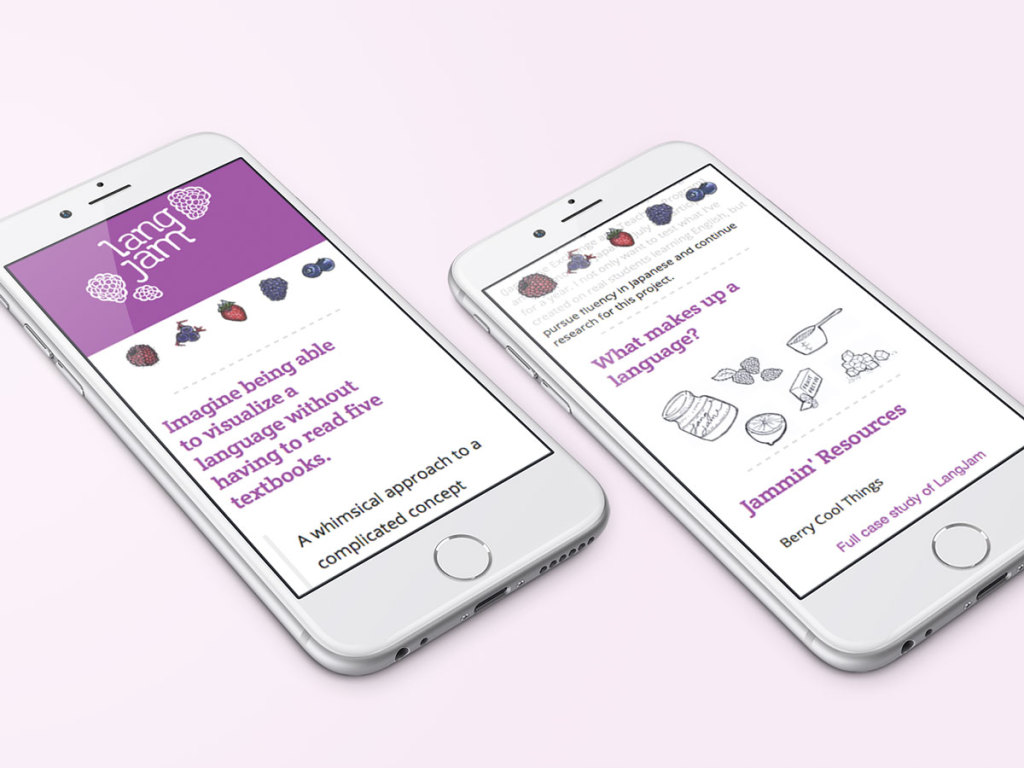
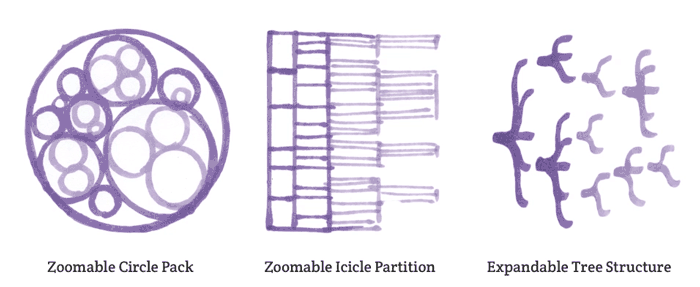
I created a website to house the project along with the project’s branding and all of the illustrations and animations. And thanks to Adam Bayacal, I have a snapshot video about LangJam, too. As far as the visualizations, my original objective was to create prototypes or working models of flexible data structures that could stand against time. After doing some research on which approach would best suit my objective, I developed three models with javascript, json files and d3 visualization libraries.
But wait… Why choose these three specific visualizations? Well, I do not have the expertise to create a custom visualization from scratch, so I am limited to the vast library of d3. However, there is a very noticeable trend in all of the visualizations currently available: They are all created for datasets that have numbers or text only.
Instead of numbers or a few words, I imagined being able to input more rich media (video, audio, images, and text) in all kinds of formats – a collection of various data.
But in reality, there is actually no data visualization library that I can think of that can do this (yet). Why? Because when people think about datasets, they only think of numbers and words.
It never occurred to me that people don’t consider video, images, audio, and other rich formats as data. Cultural data.
(At this point, I didn’t have the time/energy for a sudden meltdown because what I needed didn’t exist yet. So, I continued my project with the notion that it would be okay with just text in my datasets.)
This is a huge part of the process, actually. I had to carefully examine the data and determine how I should display and frame it. With only text, what could I accomplish? What did I want my audience to take away from it? Did I want to make hierarchy the most important part? Or grouping? Did I want to display temporal data?
That’s when it hit me. My data is unlike other data. I’m not looking for a simple percentage graph or plot chart. My data will not show change or progression over time. No statistical predictions will come from my data.
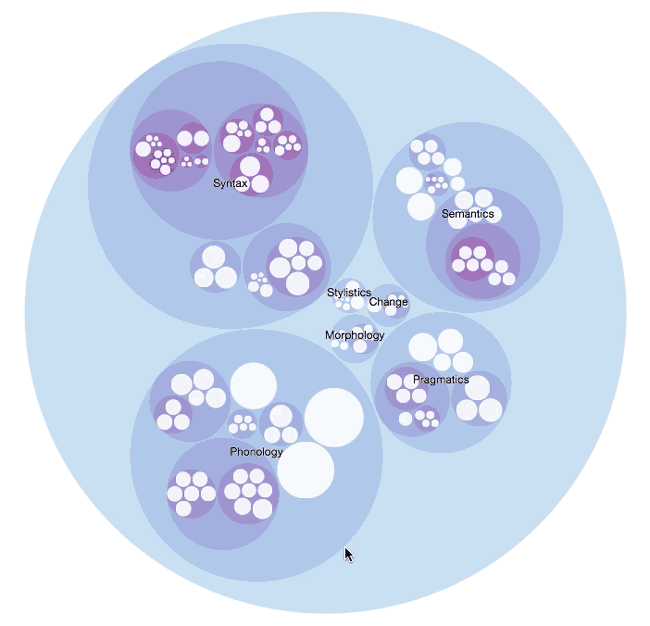
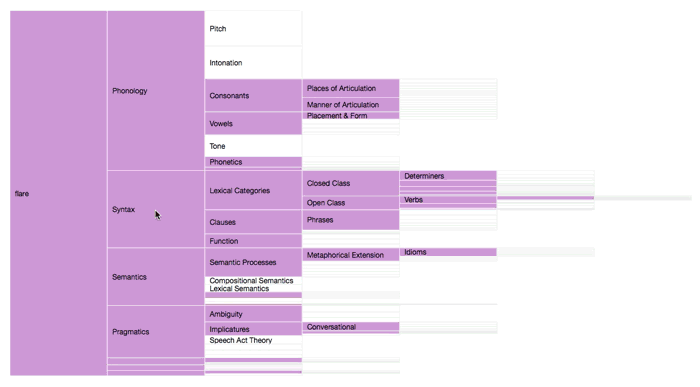
What I ended up doing was parsing English Linguistics into the datasets. I divided each main category (i.e. Morphology, Phonology, Semantics, Pragmatics, Syntax etc.) into groups, and then added their subcategories accordingly. I added as much as I could to each category and subcategory within my few-word limitation. The deepest level I could achieve was 6 levels:
Syntax > Lexical Categories > Open Class > Verbs > Conjugations > Examples
This is just an example of the level of detail I could obtain. There are no paragraphs, tables or comprehensive explanations behind these terms, but at the most brief examples. I was so frugal with my text, at one point I used acronyms to show sentence phrase structures (i.e. Verb Phrase (VP [ADVP] V [NP/S] [PP] [ADVP])).
However, I did accomplish something surprising. As I was compiling the json files and rearranging the subcategories and sub-subcategories – I felt my grasp of English linguistics expand tremendously. Now I could see the overall structure and grouping of English Linguistics much clearer (and in various ways) than before when I only studied from my textbook. This was the silver lining.
Each model is interactive, visual, and flexible in the sense that you can create different modes for the same data set. I think you should be able to mold the data like clay; the material stays the same but the shape can take different forms and functions. This is also like rearranging a formula; the variables are the same, but the formula takes on new meaning or perhaps enables you to solve a different solution.
These models can also be used for second language acquisition. Imagine seeing these instead of your standard table of contents. The interactive interface induces the learner to explore and browse – something a child of our generation would feel very comfortable with. They also enable people with different learning styles to experience personalized learning (i.e. lateral, vertical, tree, circular etc.).
The next step would be applying these models to different languages.
There were many flaws in this project. From scope to functionality, I ran into areas where changes and tweaks were needed. However, I believe this project taught me many meaningful things about data and language documentation and will continue to influence my future research endeavors. Here are a few critical challenges I faced:
Something I didn’t expect is only being able to display text data in the visualizations. Originally I had imagined an interactive visualization which included all formats and mediums of linguistic data: text, video, audio, images, etc. But I was limited to only text – which changed my scope greatly.
Additionally, I was limited to only short phrases of text (maybe 1—10 words max on third and fourth levels) otherwise the text displayed would feel crowded and unformatted. If I put too much text into the datasets, the visual aesthetic and legibility was sacrificed. I could not even insert hypertext into the data. This means there was no way of displaying rich text or connecting certain elements via links. The models soon became just an alternative way of viewing a table of contents or hierarchical data.
Furthermore, I didn’t realize until now how important displaying overlaps and connections between the topics would be. As of now, the groups are silos contained within one large group – so you cannot see nuance or complexity behind certain overlaps or connections in English. This is probably my biggest oversight.
June 1, 2016
coding, identity, interaction, language, motion / animation, research